When engineers compare switching power supplies, the first screen is usually simple: input range, output voltage, output current, package size, and price. Those numbers are necessary, but they do not tell you how the power supply will behave inside a real machine.
Three less glamorous parameters often decide whether the final equipment runs cool, passes EMC testing, and keeps downstream electronics stable: efficiency, output ripple, and load regulation. Two 24 V, 5 A supplies can share the same nameplate rating and still perform very differently once they are installed in a control cabinet, medical device, communication terminal, LED system, or embedded controller.
This guide explains how to read these three specifications, how to test them without fooling yourself, and how to balance the tradeoffs when selecting an industrial SMPS.
Why These Three Parameters Deserve Attention
Efficiency tells you how much input power becomes useful output power. The rest becomes heat. Low efficiency does not only waste energy; it raises internal temperature, accelerates electrolytic capacitor aging, increases enclosure temperature, and reduces practical derating margin.
Output ripple tells you how much AC disturbance rides on the DC output. Ripple and high-frequency noise can disturb ADC readings, reset logic devices, worsen conducted and radiated emissions, and heat output capacitors through ripple current.
Load regulation tells you how well the output voltage holds its set point when the load current changes from light load to rated load. Poor load regulation can leave no-load voltage too high for sensitive electronics or full-load voltage too low for reliable operation.
The important part is that these parameters are connected. A design change that improves light-load efficiency can increase low-load ripple. A larger inductor may reduce ripple current but add DC resistance and heat. A low-ESR capacitor may reduce ripple but shift loop stability. In power supply work, better always has a context.
| Parameter | What it tells you | Typical datasheet unit | Most common mistake |
|---|---|---|---|
| Efficiency | Conversion loss and thermal stress | Percent | Reading only the peak value |
| Output ripple and noise | Output voltage AC disturbance | mVpp | Measuring with a long oscilloscope ground lead |
| Load regulation | Steady output voltage change as load changes | Percent or mV | Confusing steady regulation with transient response |
Efficiency: Read the Curve, Not the Headline
SMPS efficiency is the ratio of output power to real input power:
*Efficiency = Pout / Pin x 100%**
If a supply takes 100 W from the input and delivers 88 W to the load, the efficiency is 88%. The missing 12 W is not abstract loss. It becomes heat in MOSFETs, rectifiers, magnetics, copper, control circuits, snubbers, and small auxiliary parts.
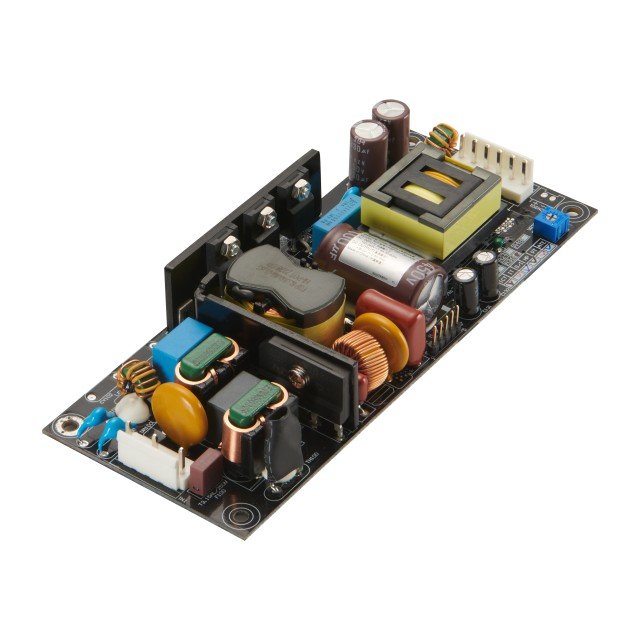
The main loss sources are usually switching loss in the power MOSFET, conduction loss from RDS(on), transformer or inductor copper loss, magnetic core loss, rectifier or synchronous MOSFET loss, and standby power consumed by the controller, driver, feedback network, and auxiliary circuitry.
A datasheet efficiency number is often measured at one favorable operating point. It may be at 230 VAC input, 50% load, room temperature, and after warm-up. That number is useful, but it is not the whole story. A buyer should ask which input voltage, output load, ambient temperature, and measurement instrument produced the value.
Full-load efficiency matters most for high-power supplies and enclosed installations. At 100% load, even a small efficiency gap can become a noticeable temperature rise. For example, a 240 W output supply at 90% efficiency dissipates about 26.7 W. At 86% efficiency, it dissipates about 39.1 W. That extra heat changes capacitor life, enclosure temperature, and fan or heatsink requirements.
Light-load efficiency matters when equipment spends much of its life in standby, sleep, or low-duty operation. Older PWM supplies often lose efficiency at very light load because fixed switching losses become large compared with output power. Modern controllers may use pulse skipping, burst mode, variable frequency control, or PSM operation to reduce standby loss. The tradeoff is that light-load ripple often increases.
Input voltage also changes efficiency. In AC-DC supplies, low-line operation generally increases current stress. In DC-DC buck converters, a larger input-output voltage difference can increase switching and conduction losses. For global products, check performance at both low-line and high-line input, not only nominal input.
| Efficiency point | Why it matters | What to ask or test |
|---|---|---|
| 100% load | Determines maximum heat inside the power supply and enclosure | Measure full-load efficiency at low line, nominal line, and high line |
| 50% load | Often near peak efficiency and useful for normal operation | Check whether the published headline number is measured here |
| 20% load | Relevant for equipment with variable duty cycles | Compare against real operating current profile |
| 5% to 10% load | Important for standby, idle, and sensor-heavy systems | Check burst/PSM behavior, no-load consumption, and ripple |
For AC input products, never calculate efficiency by multiplying input RMS voltage by input RMS current from a standard multimeter. That gives apparent power in VA, not real input power in watts. Power factor and waveform distortion matter. Use a power analyzer or wattmeter that reports real power, and measure output voltage and current at the same time.
Output Ripple: Separate Real Noise from Measurement Noise
Output ripple is the AC component superimposed on the DC output. In an SMPS, the switching action charges and discharges inductors and capacitors, producing periodic ripple at the switching frequency and related harmonics. Practical measurements also include high-frequency spikes caused by parasitic inductance, capacitance, diode recovery, MOSFET edges, transformer leakage, and PCB loop area.
Datasheets usually specify ripple and noise as peak-to-peak voltage, such as 50 mVpp on a 5 V rail or 120 mVpp on a 24 V rail. That value is not meaningful unless the test setup is known. Common conditions include a 20 MHz oscilloscope bandwidth limit, a short ground spring or coaxial probing method, and a small ceramic capacitor placed near the output test point.
The most common testing error is using a long oscilloscope ground clip. That loop acts like an antenna and can pick up switching fields from the supply, nearby wiring, or the bench environment. The displayed waveform may look dramatic, but much of it can be measurement artifact. Engineers then reject a good supply or add unnecessary filters to solve a problem that was created by the probe.
Ripple limits should match the load. Precision analog sensors, ADC references, audio circuits, and measurement front ends may need low ripple and additional post-filtering. Digital logic, relays, small motors, and solenoids usually tolerate higher ripple. For industrial 24 V rails feeding PLC I/O, sensors, and relay coils, the downstream converter or device input stage often decides the acceptable limit.
Do not chase zero ripple. Oversized LC filters can slow transient response or interact with the converter control loop. Very-low-ESR output capacitors can also change loop damping. The useful target is not the lowest possible oscilloscope number; it is a stable output that fits the noise sensitivity of the load and survives tolerance, temperature, and aging.
| Load type | Ripple sensitivity | Selection focus |
|---|---|---|
| Precision analog, ADC, sensor excitation | High | Low mVpp ripple, clean grounding, possible post-regulation |
| MCU, FPGA, communication ICs | Medium to high | Ripple within rail tolerance plus good transient response |
| PLC I/O, relays, indicators | Medium | Reliable voltage range and EMC performance |
| Motors, solenoids, heaters | Low | Current capability, thermal derating, protection behavior |
Ripple is shaped by output capacitor ESR and ESL, inductor ripple current, PCB loop area, diode or MOSFET switching behavior, feedback compensation, and load current. A heavier load usually increases ripple current. A poor layout can turn a modest ripple current into high-frequency spikes. A tired electrolytic capacitor can pass initial inspection and still create higher ripple after hot operation.
Load Regulation: A Steady-State Voltage Accuracy Check
Load regulation describes how much the output voltage changes when load current changes while the input voltage is held constant. It is usually expressed as a percentage of nominal output voltage or as an absolute voltage change in millivolts.
For example, if a 5 V supply reads 5.04 V at no load and 4.97 V at full load, the total change is 0.07 V. Dividing 0.07 V by the 5 V nominal output gives 1.4% load regulation across that tested range.
This is different from line regulation, which measures output change while input voltage changes and load is held constant. It is also different from transient response, which captures the temporary droop, overshoot, and recovery time immediately after a load step.
Load regulation is controlled by feedback loop DC gain, reference accuracy, optocoupler behavior in isolated supplies, feedback divider tolerance in non-isolated converters, output path resistance, inductor DCR, PCB copper resistance, connector drop, and any remote-sense arrangement.
No-load behavior deserves special attention. Many flyback supplies show a slightly higher no-load output voltage. Some products require a minimum load to stay within specification. If a datasheet says minimum load is 10%, do not assume the supply is guaranteed at true no load. In equipment that can disconnect its downstream load, a preload resistor or different supply may be required.
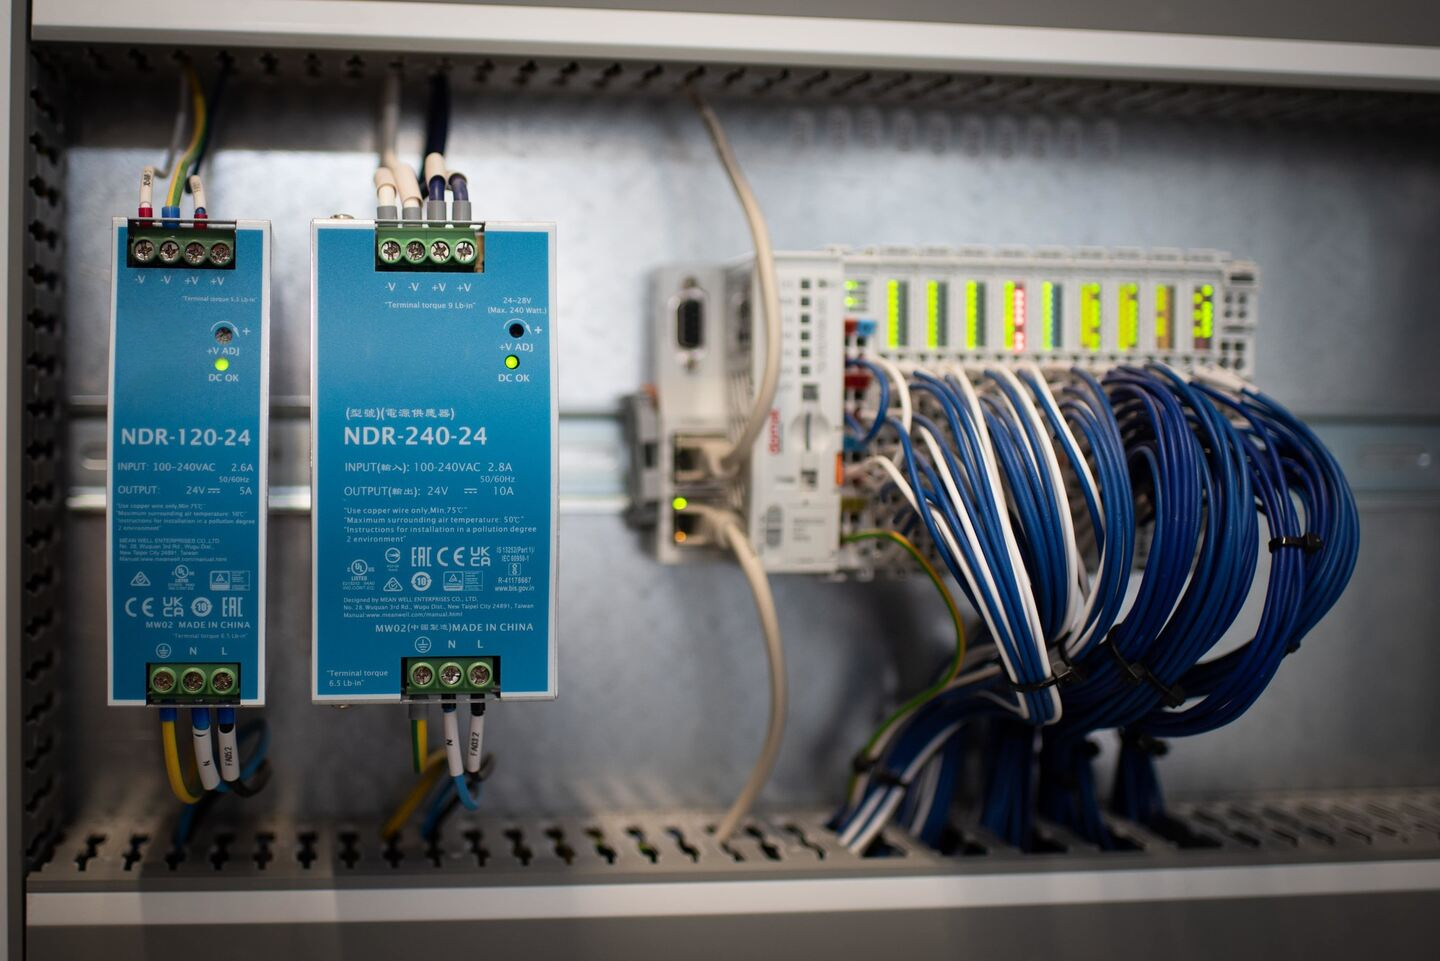
Long output wiring can make a good supply look poor at the load. The converter may regulate correctly at its own terminals, while the far-end voltage drops under current because of cable and connector resistance. In higher-current systems, remote sense or larger conductors may be needed.
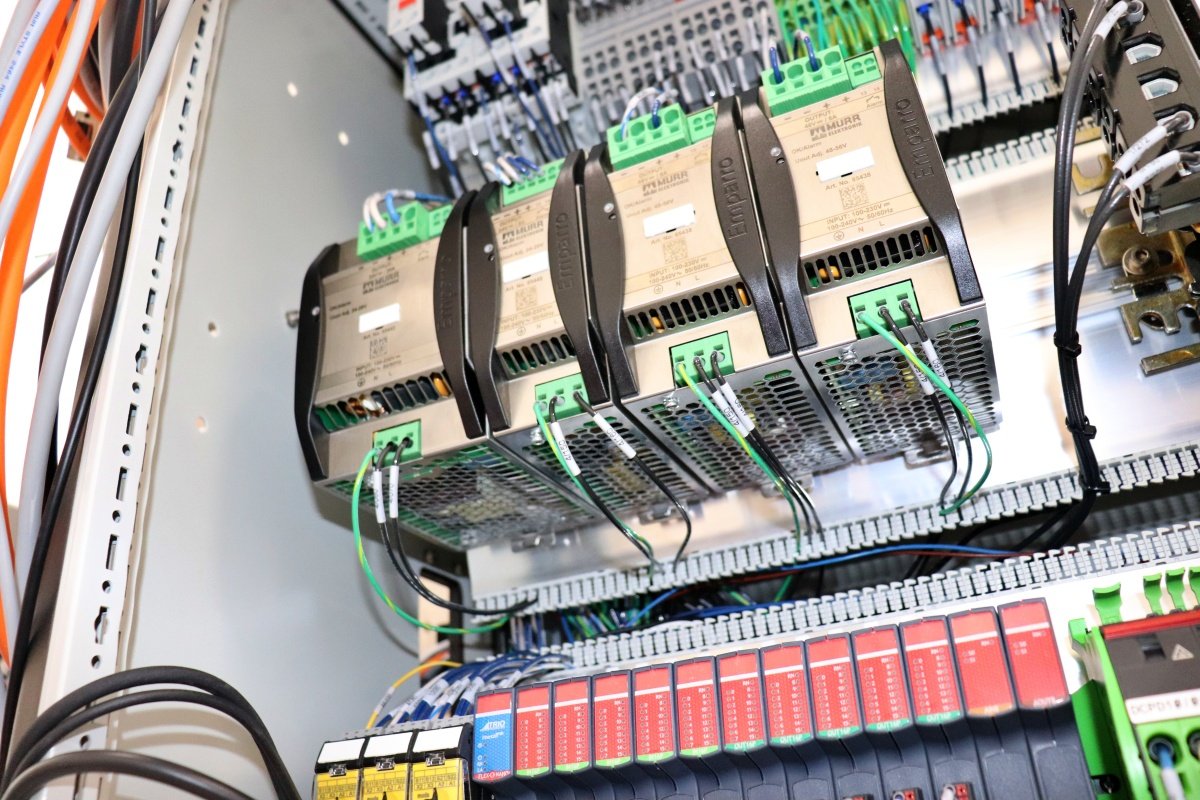
To test load regulation, keep input voltage fixed. Measure output voltage at no load, 25%, 50%, 75%, and 100% load after each step has settled. Use a reliable DMM or oscilloscope DC measurement at the correct terminals. Calculate the difference between the highest and lowest steady output values. Ignore the first spike or dip after a fast load step; that belongs to transient response.
| Datasheet term | What changes during the test | What stays fixed | What it reveals |
|---|---|---|---|
| Load regulation | Load current | Input voltage | Steady voltage accuracy across load range |
| Line regulation | Input voltage | Load current | Rejection of input variation |
| Transient response | Load current changes quickly | Test input condition | Temporary droop, overshoot, and recovery |
| Ripple and noise | Output is observed in AC detail | Defined input and load | Switching ripple and high-frequency disturbance |
How the Three Specs Interact
These parameters should not be reviewed in isolation. They come from the same physical design.
Increasing the output inductor can reduce ripple current, but a larger part may have higher DCR, higher cost, and slower load response. Moving from diode rectification to synchronous rectification can improve efficiency and reduce output path loss, but it adds control complexity and switching behavior that must be managed. Enabling pulse skipping can improve standby efficiency, yet the output ripple envelope at light load may become larger.
Output capacitors show another common tradeoff. Adding MLCCs can reduce high-frequency ripple, but the very low ESR may reduce damping. Replacing an electrolytic with a polymer capacitor may improve ripple current handling and lifetime, while also requiring a loop stability review. A good engineering decision includes the control loop, not only the capacitor value.
For B2B buyers, this means the best supply is not always the one with the highest efficiency or the lowest ripple number. A battery-powered monitor, a precision measurement module, and a 24 V industrial actuator rail deserve different priorities.
| Application | First priority | Acceptable tradeoff |
|---|---|---|
| Battery or standby-heavy equipment | Light-load efficiency and no-load power | Slightly higher light-load ripple if the load can tolerate it |
| Precision measurement or sensor systems | Low ripple and tight regulation | Higher cost or added post-filtering |
| High-power industrial supplies | Full-load efficiency and thermal margin | Moderate ripple if downstream filtering is robust |
| Long cable or distributed 24 V systems | Load regulation at the load terminals | Remote sense, thicker wiring, or local point-of-load conversion |
Practical Test Sequence for Engineers and Buyers
Start efficiency testing with a real power meter or power analyzer. Record input real power, output voltage, and output current at the load points that match the final equipment. For AC-DC supplies, test low-line and high-line input. For DC-DC modules, test minimum and maximum input voltage. Let the unit reach thermal steady state when full-load heat matters.
Measure ripple with the oscilloscope bandwidth limit enabled, usually 20 MHz unless the product specification says otherwise. Use a short ground spring, coaxial adapter, or very short probe connection at the output capacitor or specified test point. Repeat at light load, typical load, and full load because ripple can change across modes.
Measure load regulation as a settled DC value. Step the electronic load through the required current points, wait for recovery, then record steady output voltage. If the final product has long wiring, measure both at the supply terminal and at the load end. That separates power supply regulation from cable IR drop.
Finally, compare the results against the downstream circuit rather than against a generic ideal. A PLC cabinet, an LED sign, a medical sensor, and a communication gateway do not need the same margin. The right specification is the one that protects the real load across input voltage, ambient temperature, production tolerance, and aging.
Buyer Checklist
Before approving a supply for an OEM or industrial project, ask the supplier for data that matches the real operating profile.
| Check item | What to request | Why it matters |
|---|---|---|
| Efficiency curve | Data at 5%, 10%, 20%, 50%, and 100% load | Reveals standby and full-load thermal behavior |
| Input condition | Efficiency and regulation at low-line and high-line input | Avoids surprises in global installations |
| Ripple method | Bandwidth limit, probe method, external capacitor, and load condition | Prevents misleading mVpp comparisons |
| Load regulation range | Whether no-load is included and whether a minimum load is required | Protects systems that idle or disconnect loads |
| Thermal data | Temperature rise at rated load and expected enclosure condition | Helps derating and lifetime planning |
| Application fit | Sensor, PLC, motor, LED, medical, or communication use case | Aligns specs with the load's real sensitivity |
Conclusion
Efficiency, output ripple, and load regulation describe three different parts of SMPS quality: heat, noise, and voltage stability. Read them together. Ask where the efficiency point was measured, how ripple was probed, and whether load regulation includes the real load range your equipment will see.
For engineers, these checks prevent debugging loops later. For buyers, they turn a datasheet comparison into a more reliable supplier evaluation. SIPURUI supports industrial switching power supply selection with practical attention to derating, output quality, and real installation conditions, so the selected unit fits the machine rather than only the nameplate.