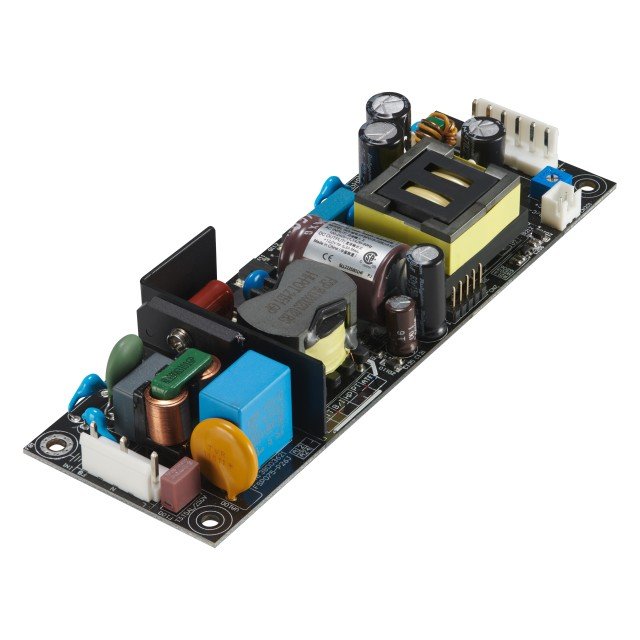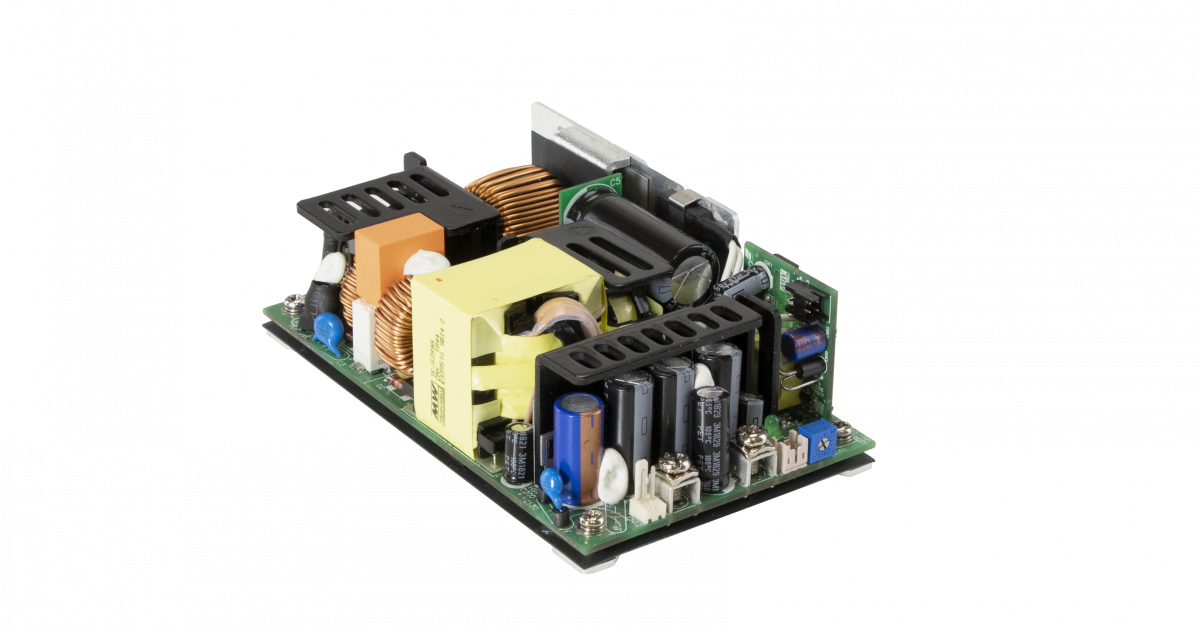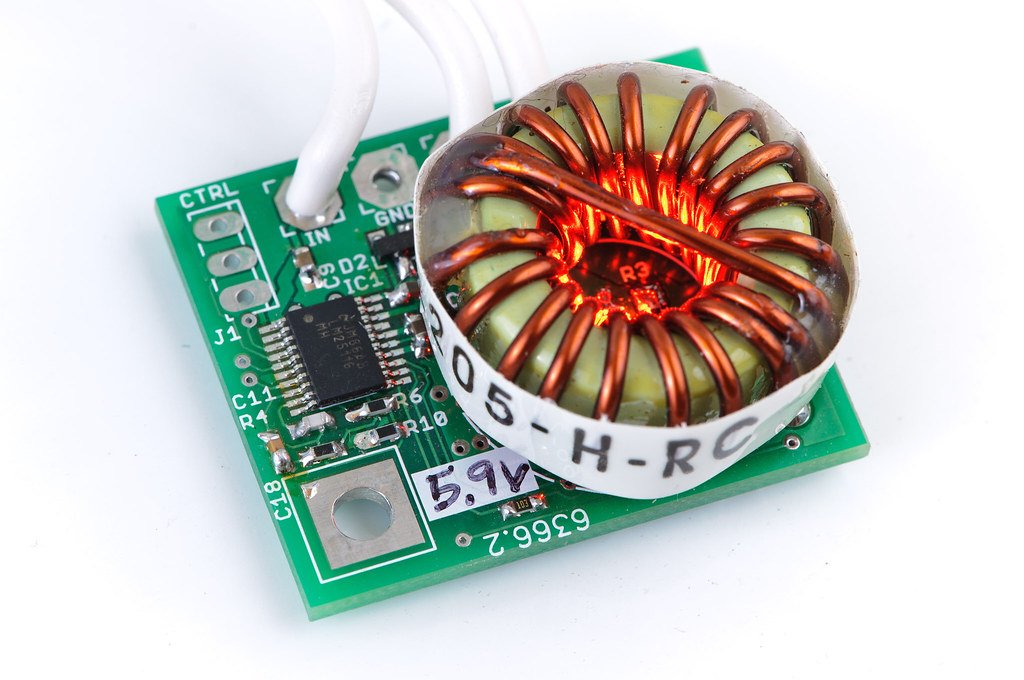
A 24 V power supply reads correctly on the bench, but the voltage falls when a motor drive, valve bank or downstream converter starts. Replacing it with a higher wattage model may hide the symptom. It can also leave the actual fault, such as a resistive connector or excessive startup current, untouched.
The fastest useful test is to measure voltage at the converter input, its regulated output and the load terminals while recording load current. Then determine whether the voltage stays low, briefly dips and recovers, or repeatedly collapses. Those observations establish where to investigate before changing components.
This guide covers industrial AC-DC supplies and board-level buck, boost and flyback converters. Equipment integrators can perform the external checks first; internal measurements require the circuit documentation and appropriate power electronics test equipment.
What a normal no load reading actually proves
At no load, the converter supplies little external power. Its output capacitor can maintain the nominal voltage even when the input path, power stage or control circuit cannot support the intended operating current. A correct multimeter reading confirms a limited operating condition; it does not establish the supply's usable power in the equipment.
Check the specified input range and any temperature, mounting or airflow derating before calling the behavior a fault. A supply can legitimately enter current limiting below its headline wattage if the installation exceeds its specified operating conditions. Likewise, a load rated at 2 A during normal operation may draw substantially more during startup.
Classify the drop before opening the power supply
Use the same load step for each comparison. Record the starting current, final current and rise time. A resistive load provides a useful baseline; an electronic load in constant-current or constant-power mode can behave differently during startup and voltage collapse.
| Observed behavior | What it suggests | Next measurement |
|---|---|---|
| Voltage settles below nominal | Distribution loss, current limiting, insufficient headroom or incorrect sensing | Compare local output and load voltage at a measured current |
| Brief dip followed by recovery | A transient energy deficit or delayed response | Capture load current and output together |
| Repeated collapse and restart | Protection, bias undervoltage or a recurring overload | Correlate restart timing with VCC and current |
| Sustained periodic variation | Possible loop instability, input interaction or load cycling | Compare input, current and switching behavior |
A waveform pattern narrows the search; it does not identify a unique cause. Repetitive operation can be normal burst mode at light load, while a large dip during a load step can drive an otherwise stable converter into protection.
For mains-powered hardware, ordinary oscilloscope channel grounds are commonly connected together and to protective earth. Do not connect them across primary and secondary references. Use suitably rated differential or isolated measurement equipment, and never disconnect the oscilloscope's protective earth. Power down and verify stored energy is discharged before changing connections.

Start at the load terminals and work back
Measure across the supply's output terminals and then across the load's input terminals under the same steady load. Include the negative return path. If the supply remains at 24 V but the load receives 22.8 V at 6 A, the measured loop resistance is:
R = (24 − 22.8) / 6 = 0.20 Ω
The interconnection dissipates I²R = 7.2 W. That is enough to justify checking individual connectors, crimps, fuses, terminal blocks and cable sections for voltage loss and heating. These numbers are an illustrative calculation, not a product test.
Probe across each suspect section while current flows. A resistance measurement with the power off may miss a connection that changes as it heats. Use a thermal camera or a suitably isolated temperature measurement where required, rather than touching energized hardware.
On a buck board, measure the regulated output after the inductor, normally across the output capacitor. The IC's SW pin is a switching node, not a DC output test point. Moving the load closer to the converter can help isolate distribution effects, but it also changes lead inductance and the test setup. Treat improvement as evidence to follow, not proof that PCB resistance is the only cause.
Remote sensing can compensate for some cable loss only when the supply supports it and the specified compensation range and connection rules are followed. Raising the local voltage to overcome a bad connector can overvoltage the load when current falls.
Check whether the input can deliver the required power
Measure input voltage at the converter terminals, not just at the upstream source display. For a DC-fed converter, a first estimate is IIN ≈ POUT / (efficiency × VIN). With an assumed 90% efficiency, a 60 W output requires approximately 5.56 A from 12 V. If the input falls to 10 V while output power remains regulated, demand rises to about 6.67 A.
That increasing current can deepen the sag through an input cable or source resistance.
Check whether the bench supply has entered constant-current mode. In the installed machine, inspect battery condition, upstream adapter limits, reverse-polarity MOSFET loss and protection-device resistance. Compare source-terminal voltage with converter-terminal voltage to separate the source from the interconnection.
Input and output falling together is a useful clue, but an overloaded or damaged downstream circuit can also pull the input down. Measure input current and repeat with a controlled load before assigning the fault to the source.
More input bulk capacitance can support a short current pulse. It cannot correct a continuous power shortage. Additional capacitance also changes inrush and input-filter behavior; check component ratings and startup performance after a change. Preserve the protective function and coordination of fuses and PTCs when correcting their voltage loss.
Separate a real overload from an early protection trip
Increase the load gradually and record the current at which regulation is lost. Then compare that point with the controller or supply specification, including tolerances and temperature. A repeated trip at a predictable threshold often means a limit has been reached, but the limit may be appropriate for the hardware.
| Measurement | Interpretation to investigate | Confirmation needed |
|---|---|---|
| Current reaches the specified limit before collapse | Genuine overload or startup demand | Actual load waveform and available derated capacity |
| Current-sense spikes coincide with switching edges | Noise coupling or measurement artifact | Short probe loop and properly referenced sense measurement |
| VCC crosses its turn-off threshold before pulses stop | Bias supply cannot sustain operation | VCC timing against the device's UVLO thresholds |
| Pulses stop before VCC decays | Another fault may have stopped switching first | Fault flags, current sense and controller protection sequence |
For a simple resistive current-sense scheme, the nominal peak limit can be estimated as VCS threshold / RSENSE. Actual behavior also depends on blanking, propagation delay, filtering, slope compensation and the controller's implementation. Output current is not generally equal to the sensed switch peak current.
Do not reduce the sense resistance just to stop hiccup operation. First establish that the transformer, switches, rectifier and thermal design can withstand the revised peak and fault currents. Excessive filtering can suppress a real overcurrent event as well as noise.
In a flyback converter, inspect the auxiliary winding's rectifier, reservoir capacitor, connections and bias voltage through the complete event. VCC can fall because the bias network is inadequate, or because another protection function has already stopped energy transfer. Use the actual device datasheet for threshold values.
Investigate the power stage when the input stays healthy
A stable input leaves several possibilities: insufficient duty-cycle headroom, current limiting, loss in the power path, poor gate drive or a control problem. Measure the switching and current waveforms before choosing which component to replace.
For a buck operating in continuous conduction, the inductor peak current is approximately the average output current plus half the ripple current. A boost converter's inductor carries input current, so its switch current rating cannot be treated as an equal output-current rating. Check the operating point at minimum input voltage, where current stress is often greatest.
Magnetic saturation is best investigated with current waveforms and the component's inductance-versus-current data. Under approximately constant applied voltage, a current ramp that becomes markedly steeper can indicate falling inductance. Temperature alone cannot distinguish saturation from copper loss, core loss or poor cooling. Distinguish the saturation current rating from the thermal current rating. Use peak and RMS current, component tolerances and operating temperature; a universal percentage margin is insufficient.
Check MOSFET gate-to-source voltage, switching timing and temperature-dependent conduction loss. A lower on-resistance device may introduce more gate charge, so replacement requires a drive and switching-loss check. For synchronous rectification, confirm that the intended device conducts during the correct interval instead of leaving excessive current in a body diode.
For flyback designs, review turns ratio, magnetizing inductance, peak current, operating mode and available on-time together. There is no universal 45–50% maximum duty cycle. Follow the selected controller's constraints. Increasing the transformer gap changes inductance and current demand and requires recalculation; it is not an isolated cure for saturation.
Verify what the feedback circuit actually senses
In a conventional resistor-divider feedback circuit, measure FB relative to the controller's specified signal ground and compare it with the datasheet reference. Also measure the output at the exact point feeding that divider.
If the local output falls and FB falls with it, the controller may be requesting more energy while a current or duty-cycle limit prevents recovery. If FB remains near its reference while the remote load voltage falls, investigate the sense location and distribution drop. A high FB reading with a low measured output calls for checking the divider, ground offset, coupled noise and probe reference. A single DC reading does not prove the feedback loop is healthy or faulty.
Inspect divider values and solder joints with power removed. For operating measurements, excessive probe loading can disturb a high-impedance node. Temperature-dependent behavior should be reproduced and measured rather than assumed to be resistor drift.
In a common shunt regulator and optocoupler feedback arrangement, rising output increases the shunt and LED current, and the primary controller reduces delivered power. The exact connection determines the polarity. An unsuitable CTR or inadequate bias may reduce control range or alter loop gain; it does not always cause undervoltage. Check the full bias range and tolerances rather than applying a generic CTR range.
Distinguish output capacitor problems from loop instability
During a sudden load increase, the output capacitor supplies the current deficit until converter current catches up. A useful first estimate separates an ESR step, ΔV ≈ ΔI × ESR, from the capacitive contribution, ΔV ≈ ΔI × Δt / C. These estimates omit lead inductance and changing control response, so use them to explain a waveform rather than predict an exact minimum voltage.
Inspect effective capacitance, ESR, ripple-current capability and temperature behavior. An aged electrolytic or a ceramic capacitor with substantial DC-bias capacitance loss can weaken transient performance even when its nominal value appears adequate.
If oscillation persists, first exclude periodic load demand, input sag and probe artifacts. Then measure loop response with a suitable injection method or follow the controller manufacturer's stability procedure. Adding ceramic capacitance or increasing bandwidth without checking stability can create another problem; boost and flyback operating modes can impose additional bandwidth constraints.
Use a repeatable sequence to confirm the repair
Change one suspected cause at a time and repeat the original failing condition. Keep a record of the probes, load mode, wiring, temperature and trigger settings so a later comparison means something.
| Test condition | Record | What the result establishes |
|---|---|---|
| Slow load sweep across the allowed range | Input, local output, load voltage and current | Regulation and the onset of limiting |
| Startup with the actual load | Inrush, lowest voltage and recovery | Compatibility with startup demand |
| Representative load steps | Step amplitude, rise time, dip and settling | Transient performance against equipment tolerance |
| Minimum input and hot operation | Voltage and component temperatures | Performance at the intended operating extremes |
| Harness installed in the machine | Supply-to-load voltage difference | Distribution performance in the final assembly |
Consider a hypothetical 5 V, 3 A flyback that restarts under load while VCC cycles between 14 V and 8 V. Those values alone do not identify an auxiliary-winding fault: first compare them with the controller's thresholds and establish whether VCC falls before switching stops. A failed bias capacitor may produce similar behavior to insufficient winding voltage.
In another illustrative case, a 5 V board measures 4.3 V at the load at 5 A. If the local output remains 5 V, the measured distribution loss is 0.7 V, equivalent to 0.14 Ω and 3.5 W. Locate the loss across the actual path before changing the regulator. Neither example is a verified customer case.
Bring the measurements into the supply selection discussion
A replacement decision should include the minimum input, sustained load, startup waveform, acceptable voltage dip, ambient temperature and cable length. These details help an equipment buyer distinguish a capacity problem from an installation problem and compare suppliers on relevant operating conditions.
For a SIPURUI power supply enquiry, share those measurements along with the required output voltage and installation conditions. The useful endpoint is a supply and installation that hold the load within its voltage tolerance through startup and normal operation, with the original failure condition retested after the correction.